Visualization

The idea is simple:

The worse the condition of the cyclepath, the more the bicycle shakes while cycling.
The more the bicycle shakes, the more uncomfortable the cycling will be.

We can measure the shaking using accelerometer data.
We can track the paths cycled using geolocation data.
Both can be recorded using a smartphone.
Both can be associated by the timestamps in the data.

Proof of concept

In June 2021 I created a small proof-of-concept. Using the mobile application phyphox to record raw accelerometer data using my phone, which was mounted on my bicycles handlebar. At the same time I recorded a GPS trace. Merging those two datasets allowed me to create a visualization of how “smooth” my ride was on specific parts of the route (green means smooth, yellow to red means not so smooth).

My little set-up was very basic, most people already have a similar configuration when using their phone for navigation or the like.

The result can be seen here on a small example route I cycled in the east of Berlin:

A route I used to record data for my proof of concept in the Wuhletal (east of Berlin).

So, yes, it worked pretty well. The darker green points are some very smooth cycle/running paths, such as this one:

Smooth cyclepath in the Wuhletal, close to the train station of the same name. Picture taken using a GoPro during some pretty nice rain.

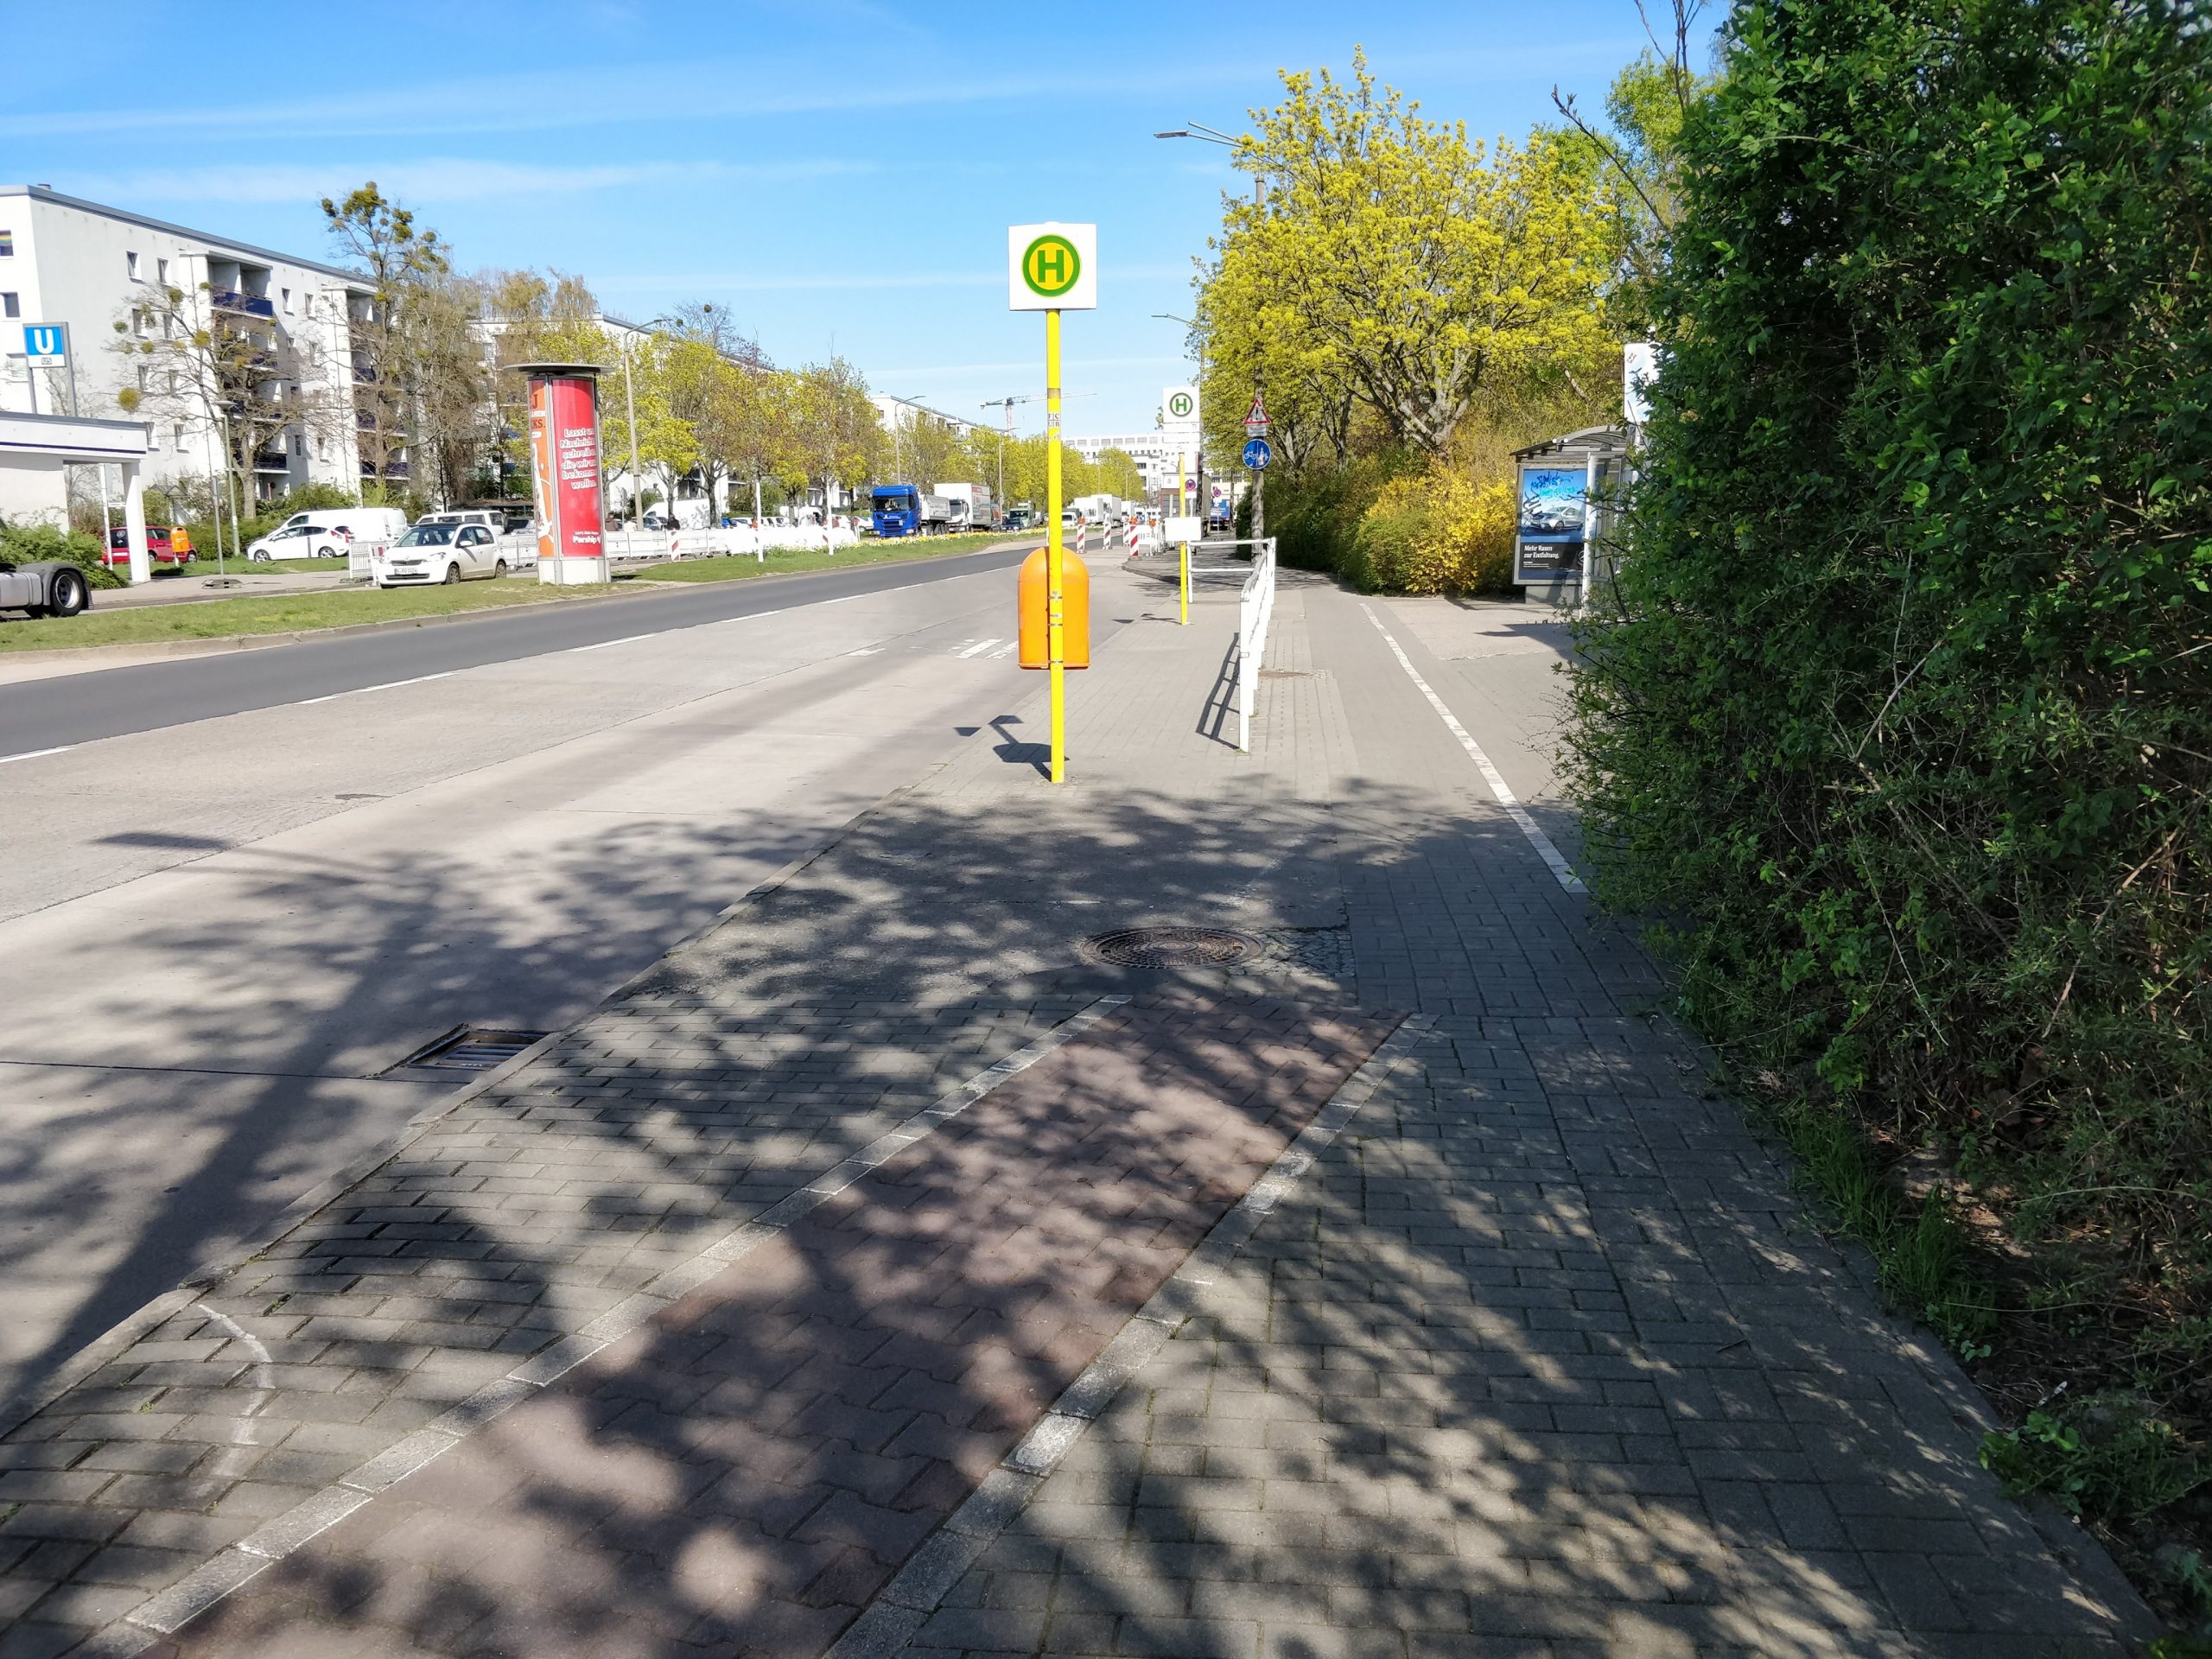
While the very heterogeneously colored points next to the U-Bahn/Metro station “Cottbusser Platz” is a cyclepath, which is in some pretty bad condition. Just have a look at this abomination of a cyclepath right next to that particular metro station, which literally eats up the pedestrian part of the way:

The slightly red bricks show the cyclepath. This picture is taken next to the metro/U-Bahn station “Cottbusser Platz” in Berlin and shows how bad the infrastructure for non-motorized participants of society can be.

The whole proof-of-concept is available as a Jupyter/Python notebook in this little repository on Github: https://github.com/Lumiukko/CyclepathConditionVisualization

The visualization, however, only shows the relative smoothness, based on that particular route.

I would really love to expand on that, but I currently lack the time, so I wanted to put my thoughts in writing. Because there are some issues…

Issues

The app. Don’t get me wrong, phyphox is a really great app and it helped me to create the proof-of-concept. However, it was originally made for physics experiments and education and does not quite fit this use-case. For one, phyphox requires itself to be actively running in the foreground to record the accelerometer data, which makes it difficult to do on a regular basis and; Secondly, running phyphox to record such raw sensor data adds a significant drain to the battery, since the sampling rate of the sensors can be quite high.

Another big issue is that the accelerometer data depends on the specific set-up used, which makes comparing the data between different users and set-ups difficult. These factors include:

  • the phone model used,
  • the mount used to attach the phone to the bicycle,
  • the bicycle itself with all components between mount and wheels / point of contact to the ground,
  • the exact trace the wheels took (even a few centimeters can make a different between a smooth ride or feeling like riding on a mogul field)
  • and the traveling speed, as faster or lower speeds may conceal certain conditions of the cyclepath, which would otherwise be visible only by looking at accelerometer data.

But don’t despair, there are some ideas how to address these problems.

Solutions

Creating a dedicated app that records accelerometer data while running in the background using a more suitable sampling rate will reduce battery drain and makes it more likely to be used on a regular basis.

This would also allow crowd-sourcing of such data. Unfortunately, merging the data is problematic, since it highly relative to the aforementioned factors. However, If cycling a very specific trace makes the difference between feeling like a milk-shake or a smooth ride, or if the bicycle configuration makes all the difference, because the phone mount may shake a little less, we could conclude that the overall experience of that cyclepath are not great. Therefore, if multiple people would cycle the same parts of a route, we could create some sort of average and create a more complete map.

Imagine the possibilities…

Addressing the issues may help to gather a large amount of data on cyclepath conditions. Such information can be used to annotate data on, for instance, OpenStreetMap. Think of route planning services for bicycle rides that use such annotations to not only suggest nice routes based on how the streets should be, but how they are in reality, based on empirical data collected by the users.

Information on the condition of a route could complement others already offered by route planning services, such as elevations and the routing itself. I would love that. Just quickly chose a route nearby for a comfortable relaxing cycle, when you’re in the mood for it 🚲

Links:

Kleine Anfragen

Kleine Anfragen sind Fragestellungen an ein Parlament, bzw. eine Regierung, welche innerhalb einer gesetzlich geregelten Frist anhand der vorliegenden Fakten beantwortet werden müssen. — Wikipedia [1]

Die Website kleineAnfragen.de [2] bietet Datensätze aller kleinen Anfragen und damit verbundenen Dokumente seit Juli 2010 an. Ich habe mir einen solchen Datensatz am 25.11.2016 heruntergeladen, welcher bis dato ca. 57.000 Dokumente enthielt. Aus den Titeln dieser Dokumente habe ich mit der Hilfe eines Python moduls [3] WordClouds generiert, aufgeschlüsselt nach bestimmten Kriterien wie Bundesland oder Partei.

Für diese WordClouds habe ich bestimmte Wörter entfernt um das “Rauschen” etwas zu begrenzen. Hierbei habe ich Deutsche und Englische Stop-Word Listen verwendet, welche häufige Wörter enthalten, die nicht viel zur Sache beitragen (z.B. Artikel, Pronomen, etc.). Zudem wurden Wörter entfernt, welche sich auf die Bundesländer beziehen (z.B. Sachsen, Sächsisch, etc.), sowie Monatsnamen (z.B. Januar, Februar, etc.), und Wörter mit weniger als 3 Buchstaben/Ziffern. Neben Wörtern wurde auch weitestgehend die Interpunktion entfernt, wobei der Bindestrich als feststehender Teil von Begriffen behalten wurde.

Bei Weiterverwendung der Bilder würde ich mich über einen Link zu dieser Seite freuen.

Für Interessierte gibt es das Jupyter Notebook zur Datenverarbeitung auf GitHub [4].


Die WordClouds

Alle Parteien und alle Parlamente

Diese WordCloud enthält die Titel aller Anfragen an den Bundestag und die Landesparlamente, unabhängig der Zugehörigkeit der Autoren.

Alle
(57.198 Dokumente)

Kleine Anfragen WordCloud, November 2016, Alle Parteien, Alle Parlamente

Aufgeschlüsselt nach Partei

Die folgenden WordClouds sind nach Parteien aufgeschlüsselt, welche die Anfragen gestellt haben. Sie beinhalten Anfragen an den Bundestag und alle Landesparlamente. Eine Anfrage kann hierbei mehreren Parteien zugeordnet sein. Die WordCloud der CDU beinhaltet nur die CDU, nicht die CSU.

CDU
(14.795 Dokumente)

Kleine Anfragen WordCloud, November 2016, CDU, Alle Parlamente


Linke
(11.026 Dokumente)

Kleine Anfragen WordCloud, November 2016, Linke, Alle Parlamente


Grüne
(9.564 Dokumente)

Kleine Anfragen WordCloud, November 2016, Grüne, Alle Parlamente


FDP
(6.511 Dokumente)

Kleine Anfragen WordCloud, November 2016, FDP, Alle Parlamente


SPD
(4.971 Dokumente)

Kleine Anfragen WordCloud, November 2016, SPD, Alle Parlamente


Piraten
(4059 Dokumente)

Kleine Anfragen WordCloud, November 2016, Piraten, Alle Parlamente


AfD
(3.114 Dokumente)

Kleine Anfragen WordCloud, November 2016, AfD, Alle Parlamente


NPD
(1.466 Dokumente)

Kleine Anfragen WordCloud, November 2016, NPD, Alle Parlamente


Freie Wähler
(1.121 Dokumente)

Kleine Anfragen WordCloud, November 2016, Freie Wähler, Alle Parlamente


Fraktionslos
(457 Dokumente)

Kleine Anfragen WordCloud, November 2016, Fraktionslos, Alle Parlamente


Aufgeschlüsselt nach Parlament

Die folgenden WordClouds sind nach den Parlamenten aufgeschlüsselt (d.h. Landesparlamente und Bundestag), an die die Anfragen gestellt wurden. Diese sind unabhängig von der Zugehörigkeit des Autoren der Anfrage.

Berlin
(9.132 Dokumente)

Kleine Anfragen WordCloud, November 2016, Berlin, Alle Parteien

Sachsen
(5.913 Dokumente)

Kleine Anfragen WordCloud, November 2016, Sachsen, Alle Parteien


Nordrhein-Westfalen
(5.279 Dokumente)

Kleine Anfragen WordCloud, November 2016, Nordrhein-Westfalen, Alle Parteien


Hamburg
(5.146 Dokumente)

Kleine Anfragen WordCloud, November 2016, Hamburg, Alle Parteien


Rheinland-Pfalz
(4.751 Dokumente)

Kleine Anfragen WordCloud, November 2016, Rheinland-Pfalz, Alle Parteien


Mecklenburg-Vorpommern
(3.689 Dokumente)

Kleine Anfragen WordCloud, November 2016, Mecklenburg-Vorpommern, Alle Parteien


Bayern
(3.525 Dokumente)

Kleine Anfragen WordCloud, November 2016, Bayern, Alle Parteien


Baden-Württemberg
(3.112 Dokumente)

Kleine Anfragen WordCloud, November 2016, Baden-Württemberg, Alle Parteien


Bundestag
(3.060 Dokumente)

Kleine Anfragen WordCloud, November 2016, Bundestag, Alle Parteien


Sachsen-Anhalt
(2.586 Dokumente)

Kleine Anfragen WordCloud, November 2016, Sachsen-Anhalt, Alle Parteien


Schleswig-Holstein
(2.452 Dokumente)

Kleine Anfragen WordCloud, November 2016, Schleswig-Holstein, Alle Parteien


Brandenburg
(2.217 Dokumente)

Kleine Anfragen WordCloud, November 2016, Brandenburg, Alle Parteien


Niedersachsen
(2.010 Dokumente)

Kleine Anfragen WordCloud, November 2016, Niedersachsen, Alle Parteien


Hessen
(1.547 Dokumente)

Kleine Anfragen WordCloud, November 2016, Hessen, Alle Parteien


Thüringen
(1.461 Dokumente)

Kleine Anfragen WordCloud, November 2016, Thüringen, Alle Parteien


Bremen
(776 Dokumente)

Kleine Anfragen WordCloud, November 2016, Bremen, Alle Parteien


Saarland
(542 Dokumente)

Kleine Anfragen WordCloud, November 2016, Saarland, Alle Parteien


Links

  1. Wikipedia: Kleine Anfragen (Deutschland)
  2. kleineAnfragen.de
  3. WordCloud Python Modul
  4. Jupyter Notebook zur Datenverarbeitung